Last year, in my survey on poker tournament profitability, I made use of a couple of databases put together from the WSOP’s Entrants Lists for 2011 and 2012 events to examine the profitability of high-volume WSOP entrants.
The WSOP only published those lists for a couple of years. One of the databases I used—which collated entries with winnings—no longer exists, though you can still check out buy-ins for both years at the bare-bones wsopdb.com. Presumably, the WSOP took some flak because of collations like the one at PokerOlymp that used the same data to show just how many of the high-volume players (those who played 50+ events those two years) lost money at the series over those two years. While a couple seasons of WSOP data is hardly a complete snapshot of poker pro’s career (or even of their year outside of the WSOP), it may not have been the image the players or the WSOP wanted to project. In any case, they’ve stopped publishing entry lists.
Without buy-in information, it’s impossible to calculate ROI, and even ITM is impossible to calculate except for those two seasons.
The World Poker Tour, well that’s another story.
The WPT player database has info on every player, whether or not they ever won any money. Twelve (or XII) full seasons of data (apologies to Anthony Zinno, whose back-to-back wins at Fallsview and LAPC in February and March would have easily qualified him for inclusion, but the stats don’t include this season). Like Hendon Mob and others, it’s oriented toward cashes, but it also includes a figure for the number of tournaments entered. There isn’t any (publicly available) info on which tournaments were played (or whether a player re-entered), so ROI calculations aren’t possible, but we can get a look at the ITM for some of the top players.
To select a group of professionals in the WSOP survey, I used PokerOlymp’s criteria of those who played 50 or more events over two years, i.e. players who could afford—either through their own money or that of backers—to drop close to $100K each year on buy-ins.
The WPT maintains leader boards for a variety of categories, and for this survey I picked a couple dozen names from each: Career Earnings (top 25), Titles (more than 1), Final Tables (more than 4), Cashes (more than 14), and Tournaments Played (more than 84). With duplicates (Phil Ivey’s stats meant he made it in via four of the lists) that came to 56 names, with 4,230 tournament entries, 735 cashes, 203 final tables, and 62 titles.
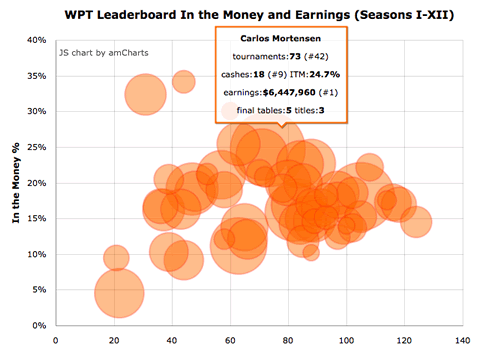
The interactive chart below maps those players by ITM and number of WPT entries. Each bubble represents a player, with the size of the player’s bubble relative to their WPT earnings over the first twelve seasons (bubble sizes are not proportional to winnings, but the larger the bubble the more money won). Rollovers show the five leaderboard items and rankings for tournaments played, cashes, and earnings (there’s not enough differentiation in final tables and titles to make rankings worthwhile).
The median ITM for this group of players is 17%—half of the bubbles are centered above that value and half are centered below. You can easily spot a number of outliers: Joseph Bartholdi in the #8 spot on the earnings leaderboard, but with only 22 tournament entries and a single cash; Mohsin Charania, whose impressive 34% ITM belied a relatively small amount of cash won (until this season’s $1.18m win at the Bellagio Five Diamond, not included in these stats); and Casey Kastle, with the third-best ITM% in the group (30%), but one of the lower earnings amounts in the group, with no final tables and no US WPT cashes for nearly a decade.
What’s fairly obvious is that there’s no direct correlation between ITM and earnings. That’s not a new lesson, by any means, but as in the WSOP survey, players with even a single large win leap far ahead of others, who may have above-average ITM over a greater number of events. Explore the stats to your heart’s content, I’ll try to update once the WPT publishes results from Season XIII!

